
Executive Summary
While today’s CRE market is healthier than during the 2008 financial crisis – with over $6.4 trillion parked in money market funds through December 2023 (Source: SEC, Money Market Funds Statistics) – a significant disconnect exists between buyers and sellers, resulting in an extended period of “sitting on the sidelines”. A lack of clarity on returns and values coupled with steadily rising cap rates have led to lower transaction volumes and slower deal closures.
Introduction
The economic landscape in 2023 exhibited a promising recovery, with real GDP growth of 2.8% driven by robust job gains and a surge in construction spending for manufacturing facilities. Nonfarm payrolls grew by 232,000 jobs per month on average and the unemployment rate stayed below 4% for 22 consecutive months, a remarkable feat not seen in over 50 years (Source: BLS). Despite the challenges posed by higher interest rates, 2023 witnessed strength in the services sector and real wage growth as inflation subsided, leading to positive trends for workers and momentum in consumer attitudes.
The outlook for 2024 according to the IMF suggests a slightly slower pace of expansion at 2.1%. This projection reflects various factors, including a potential slowdown in consumer spending, tight monetary conditions, and fluctuations in business investment and housing activity. Consumer spending is expected to decelerate due to diminished savings, plateauing wage gains, and emerging signs of stress in specific consumer segments.
The CRE market in 2023 faced challenges stemming from a labor shortage, inflationary pressures, and the continuation of Federal Reserve Bank interest rate hikes. Higher interest rates triggered increased loan defaults, causing banks to write off credit losses and expect liquidity issues to continue over the next year. In an effort to contain further losses, banks pulled back on lending – with 3Q 2023 loan volume down 7% from 2Q 2023 and down 49% from a year ago (Source: Mortgage Bankers Association). These losses had widespread impacts, affecting every sector and investor type within the commercial real estate market.
Buyer/Seller Sentiment
While there is appetite for commercial real estate investment, an asset type commonly thought to be desirable in an inflationary environment, people are taking a lot longer to make decisions because they are nervous about higher borrowing costs and externalities such as geopolitical tensions, government policies, uncertain inflation and wages. As such, Coldwell Banker Commercial professionals noted that transactions have been commonly completed with all-cash, 1031 exchanges and seller financing at cap rates that moved up 100-300 basis points, on average, to close the deal. While 1031 exchange money has been buying buildings due to tax pressures, buyers with no time constraints have been moving slowly to find the “right” property – one that yields a return commensurate with today’s higher-risk environment.
Expect 2024 to be a year of caution as investors try to figure out valuations just when rising cap rates begin to settle down. Sellers will likely hold onto their property for cash flow and try to “survive until 2025” when values are expected to stabilize if interest rates are down and there is more clarity on government policy. Sellers who have enough equity in their assets will wait for a better pricing environment. As a result, we expect sales activity to remain muted until interest rates decrease.
EXHIBIT 1: CAP RATE SPREADS OVER 10-YEAR US TREASURIES ARE NARROWING
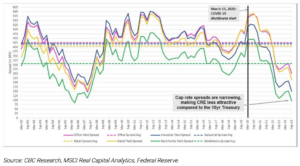
While cap rates have climbed up steadily over the last two years, 10-Year Treasury rates saw a seismic shift (+350 bps) and now offer a compelling alternative for investors to park their money while waiting for the economy to unfold. Our commercial professionals are seeing an increase in 1031 exchange clients willing to pay the capital gains tax so they could put their money into risk-free CDs instead of overpaying for another commercial property. Investors would rather wait for the market to shift before finding a better return – even if it’s later. CRE prices have to come down more to get cap rates competitive with alternative investments.
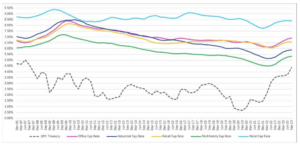
EXHIBIT 2: HISTORICAL CAP RATES VS 10-YEAR US TREASURIES, BY SECTOR
Banks have pulled back; Cash is king
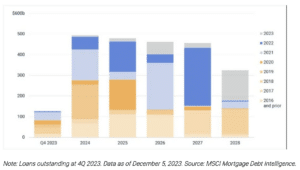
Notably, major banks are exercising caution in lending, turning away clients with excellent credit and substantial assets as they brace for a recession and prioritize holding onto cash. Many are opting to watch from the sidelines as a wave of low-rate debt maturities will be rolling in this year and into 2025.
EXHIBIT 3: US LOAN MATURITIES BY ORIGINATION VINTAGE
Financing availability has pulled back across the board, but some sectors are finding lenders more amenable. For industrial and retail, capital is constrained but available for very good properties. Funding for construction projects and office buildings, however, has become extremely hard to find, especially for less premier tenants.
Lender equity requirements have grown significantly more stringent, with banks now requiring 50% down and 80% preleased (versus 25% down and 60% preleased a few months ago). Given this, seller financing has been getting deals done and often at rates just below the bank. The exception seems to be small markets with very strong local economies backed by businesses that are thriving – regional banks in these markets are alive and well and lending heavily.
Sales Trends
Sales have slowed down dramatically across all sectors, largely due to the significant cap rate discrepancy between buyers and sellers. Many markets are seeing a lack of motivated sellers (and therefore have no inventory). Buyers are not willing to overpay for property when interest rates are high. And contrary to the expectations of many people, very few distressed assets have materialized in 2023 – causing a lot of money to wait for the wave of refinancings coming in 2024. It is only when that happens that sellers will be forced to recognize (and accept) today’s lower prices. As such, investors have pushed their timeline for “waiting” out by another 12 months.
Despite tough economic conditions, many small businesses flourished in 2023 and are growing. Owner-users drove most of the buying in our markets, buoyed by their stability, expansion plans, and ability to prioritize their business operations over cap rate considerations. Despite higher rates, they’re willing to pay more than an “investor” because they aim to occupy the space. These companies span various industries like healthcare, law, finance, accounting, engineering and construction, and currently need new space.
Because sellers are not able to get the valuations they want, the inventory pool is reduced. The only people unloading today are those with life-changing situations (death or divorce), loans coming due, 1031 exchanges, or the desire to exit the asset class. There’s also a lot of generational wealth being passed on from baby boomers to Millennials and Gen Z. These “kids” would typically sell right away because they are not interested in keeping the business or property. However, in the current high cap rate environment, they are preferring to wait. We believe 2025 will be the year that sellers can get the numbers they want.
Leasing Trends
Our professionals reported that leasing in secondary markets is robust and picked up a good portion of the 2023 sales shortfall. Rental rates are high for flex industrial, retail and small office, and continue to go up without pushback due to limited inventory, jumping as high as 30-40% in markets experiencing major company relocations. Flex, retail, and small office spaces outside of downtown markets are seeing low vacancy rates and not enough projects under construction or finishing on time to meet the increased demand from expanding businesses, new residents, and would-be buyers who want to lease space. For many of our commercial professionals, 2023 was just as busy as 2022 (a record year for CRE) with no shortage of small portfolio holders and local business owners looking to lease “small” retail, office, and warehouse buildings.
EXHIBIT 4: HISTORICAL VACANCY RATES
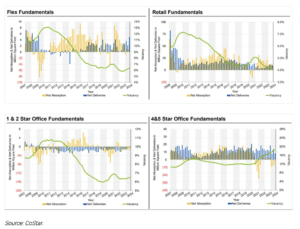
Contrastingly, CBD markets particularly in large metros faced challenges with rising vacancies and declining rents in nearly every sector. Properties in these markets are hard to move because rents have peaked and a lot of tenants are not renewing or require less space. Class A office space is faring better than Class B and C properties, many of which may be evaluated for conversion to residential or mixed-use space.
Industrial Sector
Following years of rapid expansion, rent growth and near-zero vacancy rates, the industrial sector has begun to cool off as it faces new challenges. Many markets do not have enough suitable properties to meet demand because most of the availability comes from functionally obsolete buildings; facilities with modern logistics, ample dock doors and adequate ceiling heights remain in high demand. In our coastal markets, rising vacancies and peaking rents are causing large developers to pass up prime development sites to focus on leasing spec product before embarking on another project.
The greatest demand for industrial has come from local contractors, suppliers, businesses sizing down and those that need more dropshipping – all looking for small warehouses and flex space (5,000-20,000 SF).
Our professionals noted that prices in this segment have not come down and rents are still rising. There’s a shortage of small buildings as most of the new construction in 2023 went to 100,000+ SF footprints, all of which were pre-leased to major corporations. Companies generating profits (such as those in R&D, biotech, data centers, oil, energy, plastics, aerospace) have been buying buildings for their own use.
EXHIBIT 5: INDUSTRIAL RENT GROWTH, BY MARKET
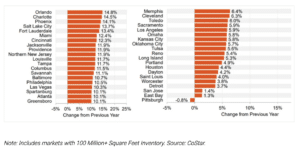
There is cautious optimism in the industry for the latter part of 2024, especially post-presidential election, as potential policy shifts could favorably impact the market. While industrial vacancy rates are expected to rise this year, they should remain below historical averages, signifying potential stabilization amid ongoing challenges.
Retail Sector
Outside of CBDs, the retail sector has desirable investor demand, particularly from cash buyers and 1031 exchanges. Cap rates are still rising but at a moderated pace as investors pursue stable assets such as auto dealerships, grocery-anchored centers, medical offices, and national credit tenants. While big box stores have been shrinking, entrepreneurs and local retailers have thrived and are looking to expand. Coffee shops, QSRs and restaurants were growth uses. Well located malls are fully occupied and seeing signs of life as borrowers negotiate loans with extensive equity. Developers continue to move forward with buying land and building more retail, particularly in markets where population growth is strong.
On the leasing side, retailers across the board (from national brands to mom-and-pops) have asked for concessions. Property performance greatly varied by location this past year: retailers and restaurants in CBDs that cater to weekly office users (such as drycleaners, cafes, lunch spots) may never fully recover. However, retailers in the suburbs and neighborhood centers and those with good street access and easy parking are supported by the community around them and doing well. We expect retail to remain stable in 2024, driven by the growth of neighborhood businesses and franchisees.
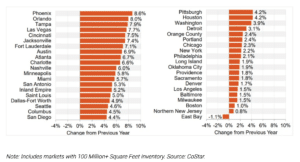
EXHIBIT 6: RETAIL RENT GROWTH, BY MARKET
Office Sector
Amid challenging sales conditions, office lease renewals were of key importance in the office sector as landlords retained tenants by offering concessions (parking, free rent, tenant improvement allowances). Suburban office properties outperformed CBDs and coastal cities due to increased demand for smaller spaces (1500-3000 SF) that are closer to home for professionals like doctors, dentists, accountants, engineers and lawyers. Markets such as Florida, Arizona and Georgia continue to see influxes of early retirees and relocators that are bringing new businesses with them and driving rents higher.
High-rise buildings, on the other hand, were extremely challenged with rents down more than 20% and a lot of foreclosures on the horizon. Significant vacancies and funding challenges in this segment are leading many buildings to be evaluated for conversion. The much lower rents are starting to entice office users to upgrade to “better” buildings in cities like San Francisco and New York on a low-key basis as employees of AI, life science, and finance companies are made to come into the office 3 days a week. Restaurants and coffee shops are staying open longer to cater to this crowd.
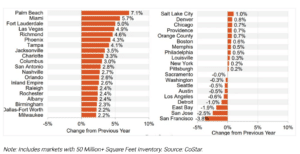
EXHIBIT 7: OFFICE RENT GROWTH, BY MARKET
With funding difficult to obtain, the outlook for the office sector remains uncertain. The big question is will office buildings go back to the banks. Corporate users are willing to pay lease termination fees and downsize, particularly in Class B and C buildings.
Multifamily Sector
Multifamily activity in 2023 was mixed. Some markets saw healthy rent growth while others faced challenges due to oversupply and financing constraints. Market-specific dynamics have shaped the landscape, reflecting varied sentiments and opportunities. The Sun Belt region saw the largest influx of new deliveries, which flattened rent growth despite strong demand. Places like Austin, Las Vegas, Phoenix and Jacksonville saw rents drop by 3-5%. Conversely, the Northeast and Midwest (which didn’t have a supply surge) saw rents go up.
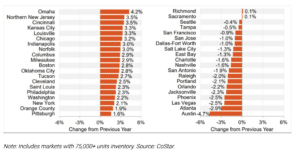
EXHIBIT 8: MULTIFAMILY RENT GROWTH, BY MARKET
Metros like Boston, San Francisco and Minneapolis are seeing activity pick up with investors paying cash for small buildings in the $1-3 million range or scooping up property with 6-7% cap rates (compared to 3-4% caps two years ago). While most buyers are self-funded, we see banks willing to lend on strict terms. While demand in markets like Los Angeles and Seattle are healthy on the whole, rents in certain areas have peaked as vacancies start to rise.
Developers in high-growth (Sun Belt) markets have overbuilt luxury apartments and don’t have enough “regular” housing which is needed to support the new job growth being created by company relocations and expansions. Build-to-rent has also become challenged as big companies are buying entire subdivisions but waiting for rates to come down to build workforce housing.
While “better” buildings are being sold at prices similar to 2019, most buildings are seeing prices go down. Banks prefer not to lend more to this asset sector even for qualified buyers. Can rents go higher to make the deal work? Not always. Given these conditions, investors are choosing to wait on the sidelines.
Conclusion
The economic landscape in 2023 showcased resilience in the face of interest rate hikes and positive indicators, but challenges lie ahead in 2024. While the job market remains strong and consumer sentiment is recovering, geopolitical tensions and uncertainty around policy shifts and their impact on the CRE market pose concerns. Outside of life-changing situations that create a need to transact, private investors will “sit on their wallets” and monitor the market. The majority of buyers today are not in 1031 exchanges and are taking their time to find the “right” property. At the same time, most sellers that are not overleveraged have no reason to sell at a discount. As a result, we expect activity to remain muted in early 2024, then gradually pick up momentum as loan defaults and foreclosures increase, and more confidence in interest rate trends builds. Only after the Fed begins to lower interest rates will appetite truly return.
What to do in the meantime? Use the prolonged waiting period to develop a strategic approach. Focus on building a pipeline, meet new people, start creating relationships, prep as many properties as possible, educate people on the current climate and how to prepare now for when the market recovers. Download the report here.
Jane Thorn Leeson is a Research & Resources Analyst with Coldwell Banker Commercial.
Coldwell Banker Commercial®, provides commercial real estate solutions serving the needs of owners and occupiers in the leasing, acquisition and disposition of all property types. With a collaborative network of independently owned and operated affiliates, the Coldwell Banker Commercial organization comprises almost 200 companies and more than 3,000 professionals throughout the U.S. and internationally.
Updated: February 1, 2024
A Trusted Guide in Commercial Real Estate
Coldwell Banker Commercial® provides Commercial Real Estate Services from Property Sales and Leases, to Property Management. Learn how our expansive network of Independently Owned and Operated Affiliates and Real Estate Professionals use their in-depth knowledge of the local market and industry trends to help businesses and investors navigate the complexities of the commercial real estate landscape.